 zpew
Does a better volatility model actually forecast better?
zpew fits EWMA and GARCH(1,1) models to daily prices and tests every forecast out of sample, against what actually happened next.

What it does
Volatility forecasts drive risk limits, position sizes and Value at Risk. zpew checks whether they hold up when a model can only see the past.
-
Three standard models
Rolling realised volatility as the baseline, RiskMetrics EWMA, and GARCH(1,1) fitted by maximum likelihood.
-
Honest out-of-sample tests
Every forecast uses only data available at the time, enforced by a no-look-ahead test, with sliding and expanding windows.
-
Two proxies, two losses
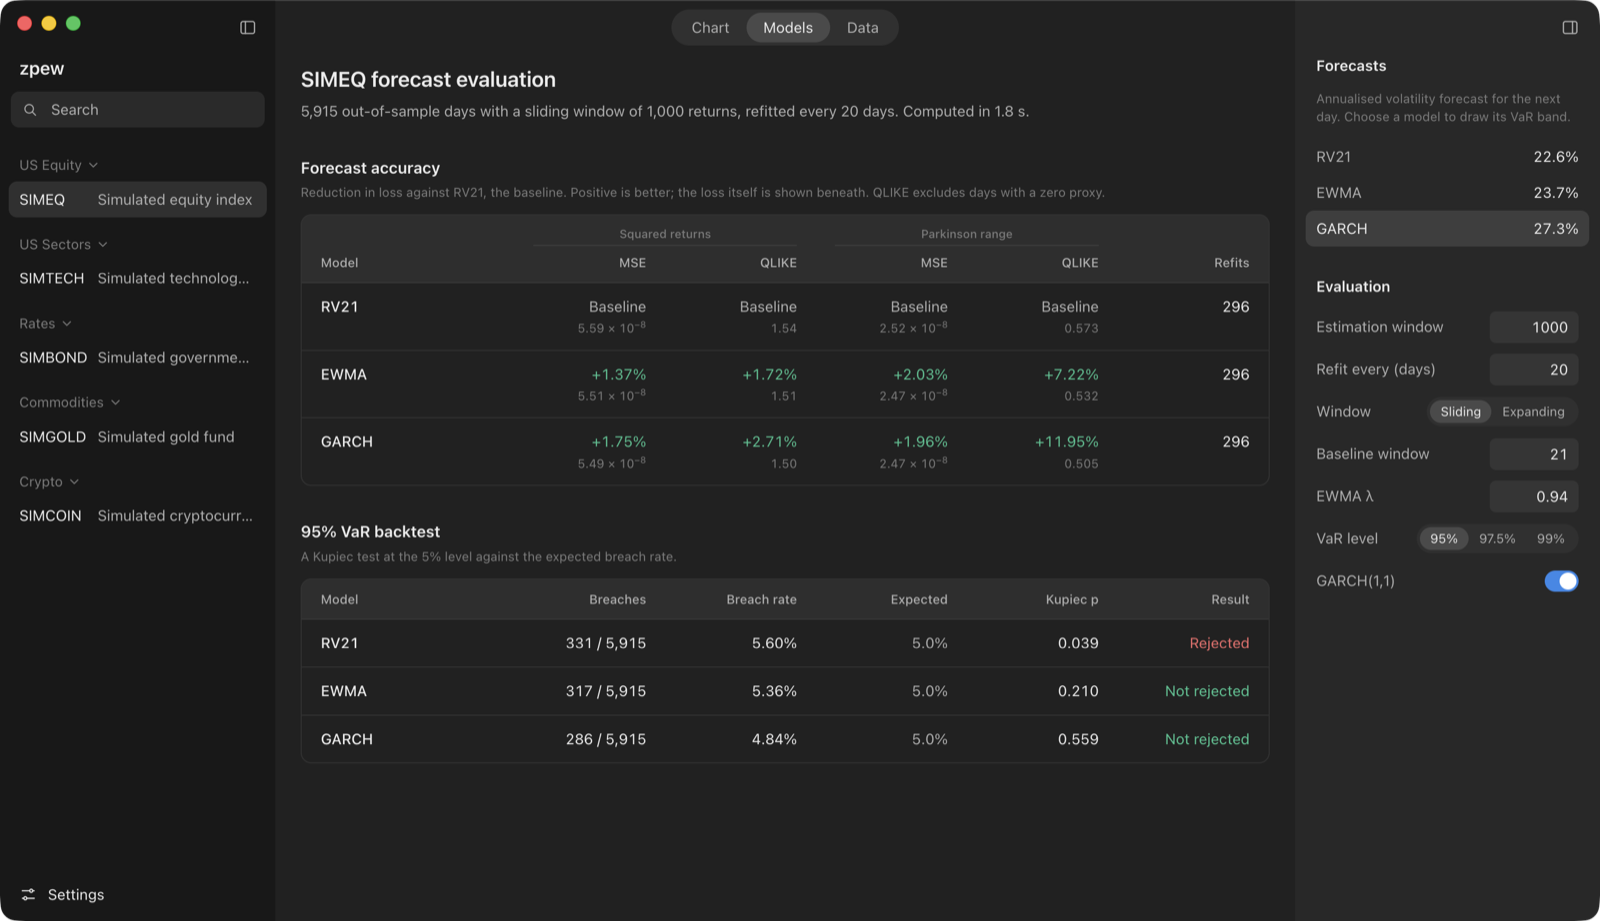
Forecasts are scored against squared returns and the Parkinson range, with MSE and the noise-robust QLIKE loss.
-
VaR backtesting
One-day VaR at 95% and 99%, with breach counts and the Kupiec proportion-of-failures test.
-
Cross-checked
EWMA is checked against an independent implementation, and GARCH(1,1) fits against the Python arch library, on every asset.
-
Reproducible
Runs start from hashed data snapshots, and every result records the commit, compiler and config that produced it.
A desktop app built on the same core
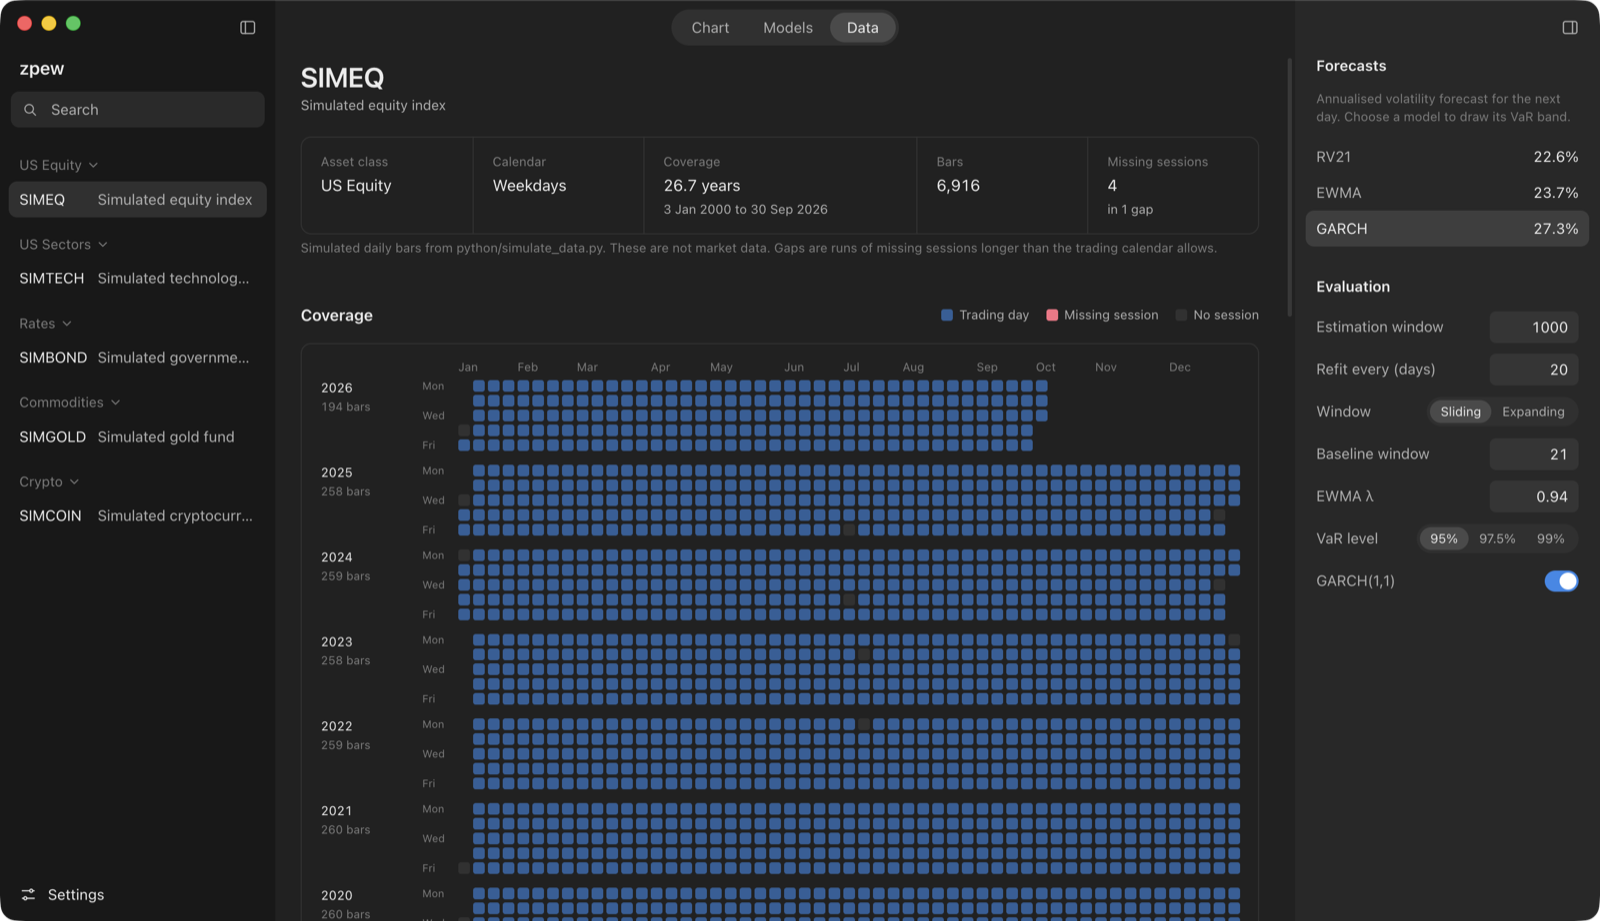
The analytics are a C++20 library. The desktop app calls it through a native addon and draws everything on its own Canvas charts, recomputing forecasts as you change the settings.
Results are not published yet. They will appear on the results page once the official runs are made from a clean commit.